
This post is used to collect some key concepts and syntax in Looker.
Terms used in Looker:
- database dialet: refers to SQL syntax of a particular DB management system like Postgresql, MySQL, or Oracle …
- View (.view) : defines a table in Looker, like a schema for a dataset, including “dimensions” and “measures”.
- Explores : a combination of many “views” joined together
- Model (.model) : define database connection & a container for “explores”.
- Key concepts:
- Dashboard:
- Boards:
- My Folder: a personal folder (only you can see). (new subfolder can be created)
- Shared Folder: shared across an organisation (most people can see).
- We can create many new sub-folders inside this “shared folder”, we can create like Sales subfolder, Inventory subfolder, Clients subfolder,…
-
People folders: shows all folders that we have permission to access.
- SHARING = DATA DELIVERY
-
sharing or scheduling a look file: can schedule to send a Look every Friday at 3pm. -
sharing or scheduling a dashboard: can even schedule and choose Timezone of the recipient by ticking “Run schedule as recipient”. 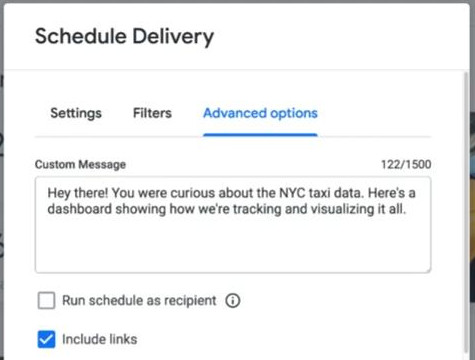
-
- Key syntaxes: ${…}
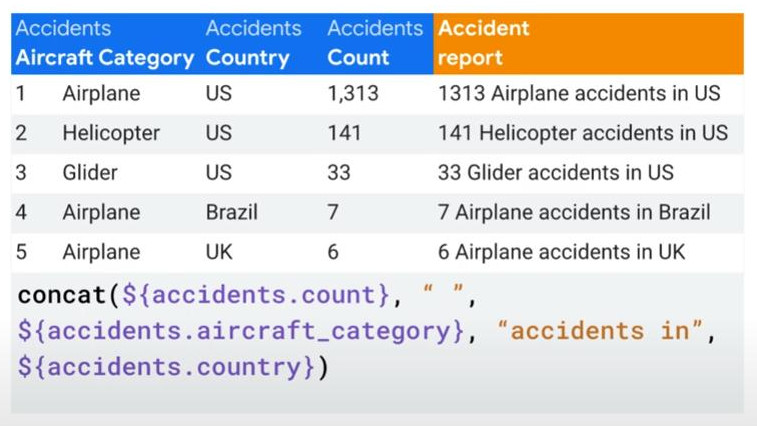
- concat(str1, str2): aggregating all strings => concat(${}, “123”, ${})
-
-
round(${orders.amount}, 0) : rounding a number to the nearest integer with 0 decimal digits.
-
mean(${orders.amount}) : calculate an average.
-
if(${movie.revenue} > ${movie.budget}, “yes”, “no”) : condition syntax.
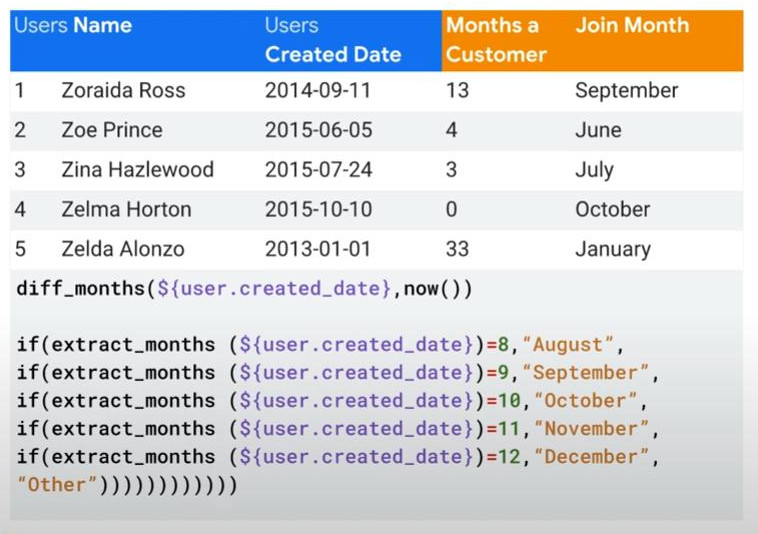
- if(extract_months(${user.created_date})=8, “August”, “Others”): take only the month from a date.
-
-
diff_months(${user.created_date}, now()) : how many months from now.
-
${order_items.order_count:total} ‘total’ = sum() all. - Offset calculations: (‘offset’ means ‘jumping’)
- regular_offset(): reference to upper or lower row in a column.
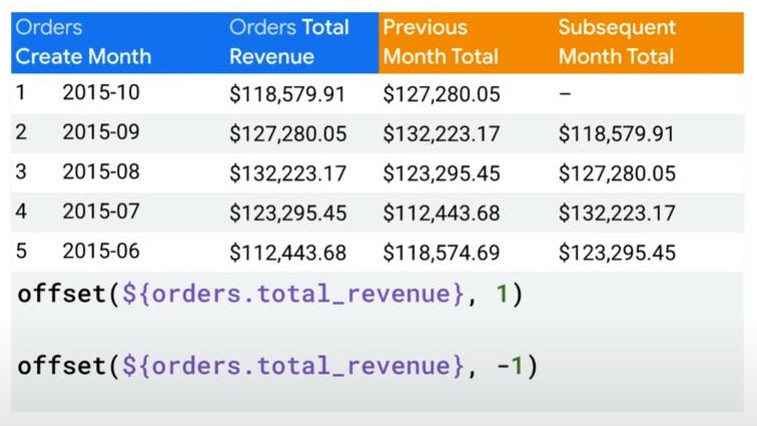
- offset(${orders.total_revenue}, 1) : show previous month revenue in the same column following the order of the table.
- offset(${orders.total_revenue}, -1) : show subsequent(next) month in revenue in the same column following the order of the table.
-
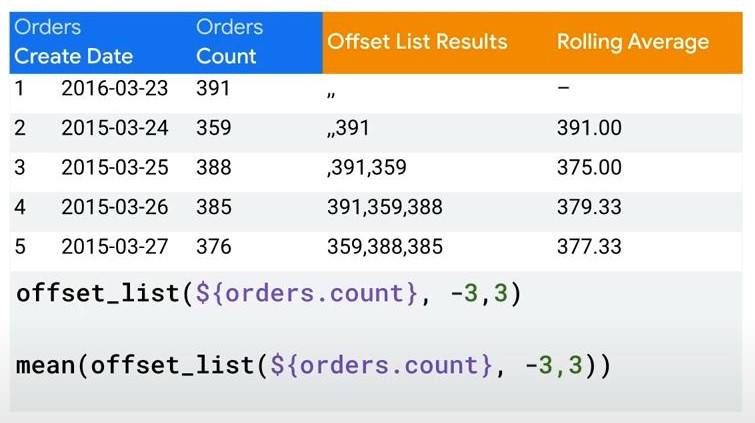
- offset_list(): (rarely) reference to multiple rows and combine them in one row, mainly for calculating rolling average.
-
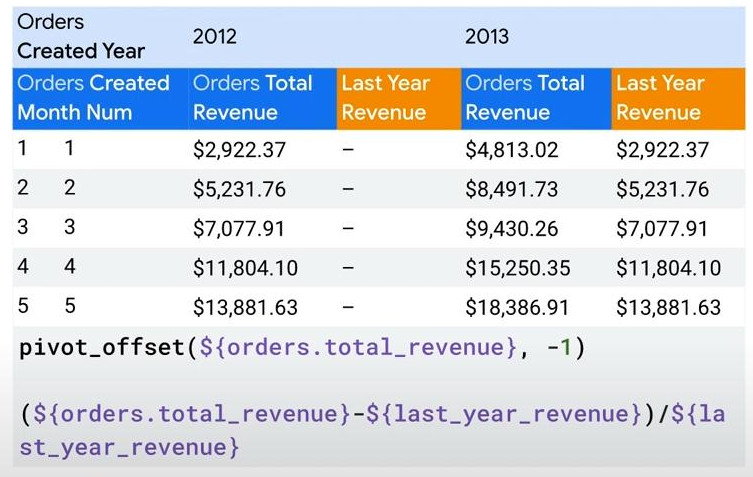
- pivot_offset(): reference column to the left or right (should be in a pivoted feature)
- pivot_offset(${orders.total_revenue}, -1) : show same month revenue of previous year (column) following the pivot dimension of the table.
- regular_offset(): reference to upper or lower row in a column.
-
filters: [order_is_canceled: “Yes”]
-
sql: 1.0*${total_revenue_from_canceled_orders}/NULLIF(${total_revenue}, 0) ;;
-
For LookML developer :
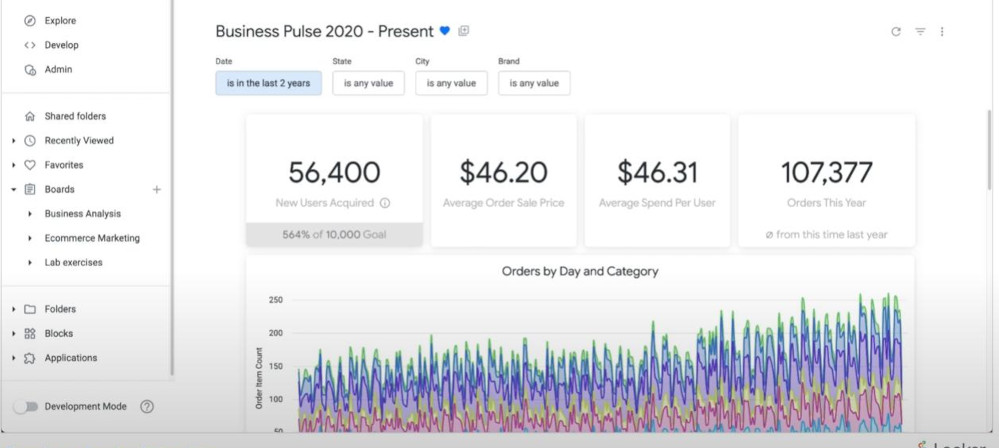
- BI (Business Intelligence): Looker can help to create and monitor some KPIs like “number of new users” in the dashboard below:
-
-
Connecting to Database is handled by Admin but LookML developer can see this connections by clicking “Develop” => “SQL Runner” at the top left corner.
-
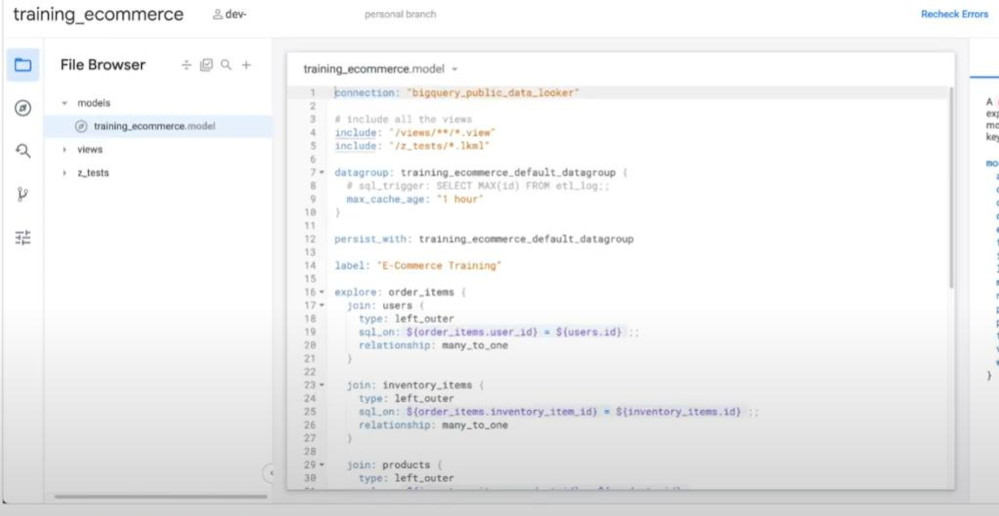
Ctrl+Shift+D: is a short-cup to open the “Development Mode” in LookML. Alternatively, at top left corner, click “Develop” => “Projects” => turn on “Development Mode” => choose the project NAME “training_ecommerce” inside an built-in IDE of Looker.
-
- Version Control: available in LookML IDE:
- allow a collaboration as a normal Git.
- Can revert “uncommited changes”
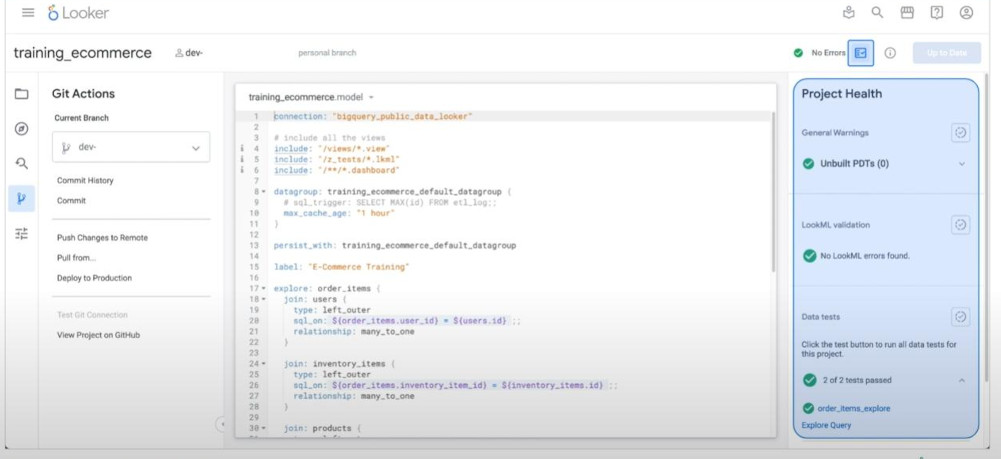
- “Project health” is a tool to check whether a change is correct or not.
- Any time we open the “Development Mode” a new local branch will be auto created by LookML for developing.
-
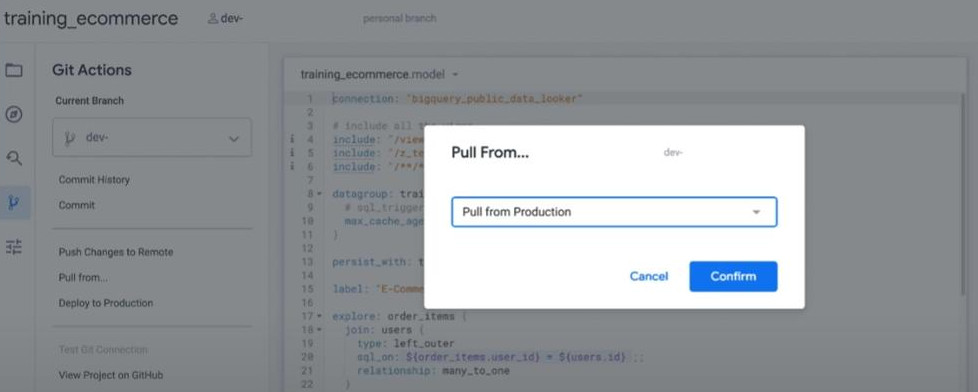
- Note: Best practise is always do the “Pulling” from the Production before developing a new feature.
-
- Validation & Commit changes and Push:
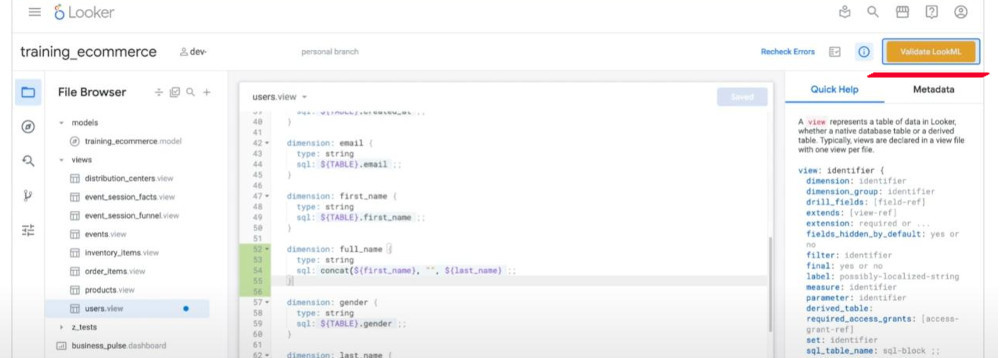
- We can use “validate LookML” to validate any changes we make.
-
- Before “Deploy to Production” we should do the “Project Health” test.
- Resolve “Merge conflichts” can be done in LookML IDE as well.
-
LookML (Looker Model Language): any SQL queries will be able to be re-written by LookML to achive the same task.
- A LookML Object hierarchy: Project > Model > Explore > View (order_items.view)
- A project is mapped 1-to-1 to a Git repository.
-
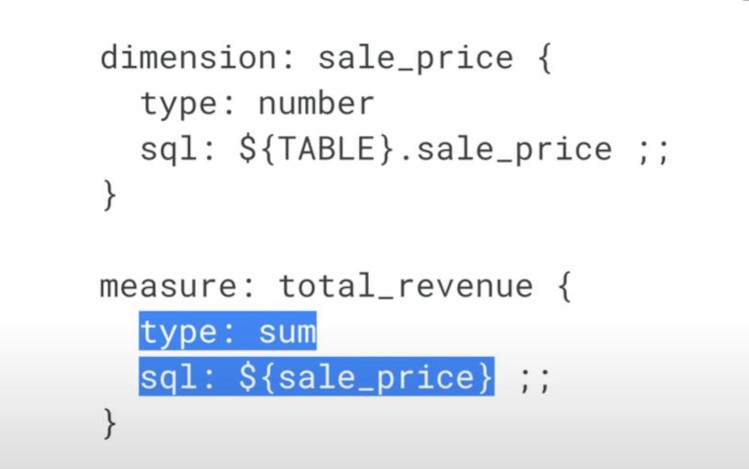
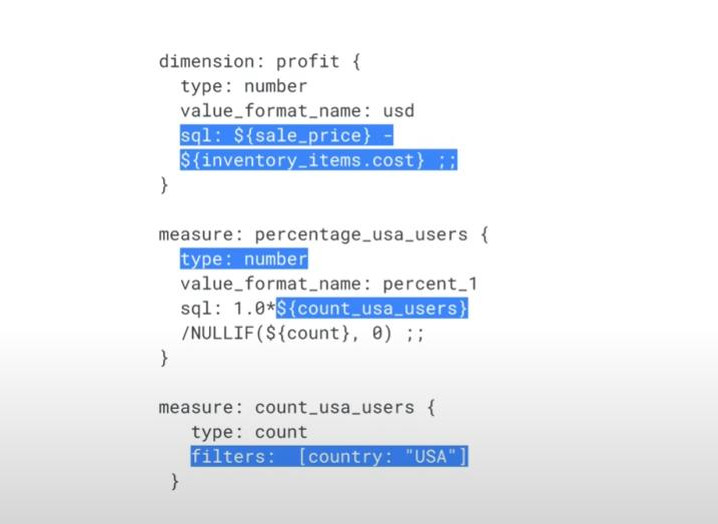
A View should contains “Dimensions” and “Measures”
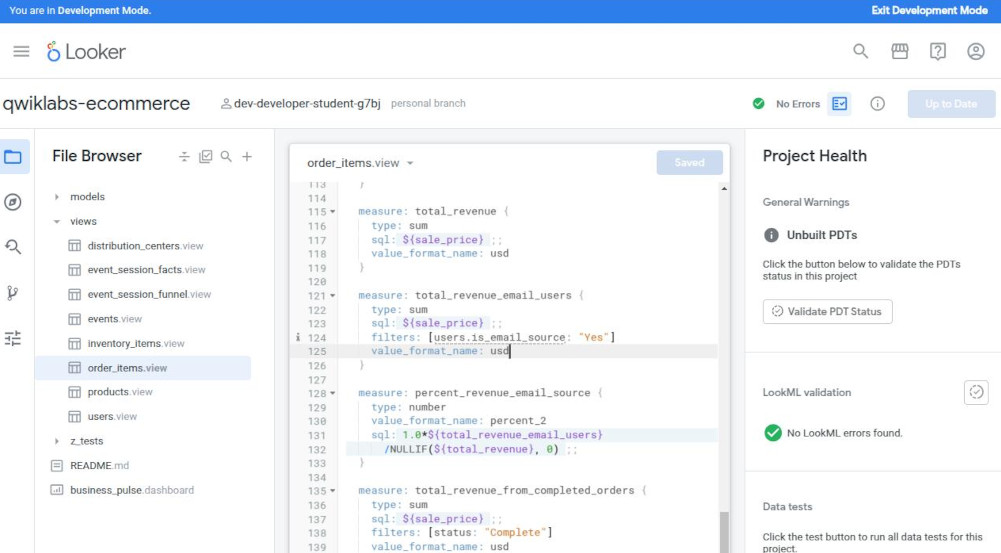
- Model dimensions & Model measures: (Before commiting, we can try our new dimension or measure locally at the Explore component, just refresh it)
-
- Advanced dimensions & measures with “filter”:
-
- Practice:
-
-
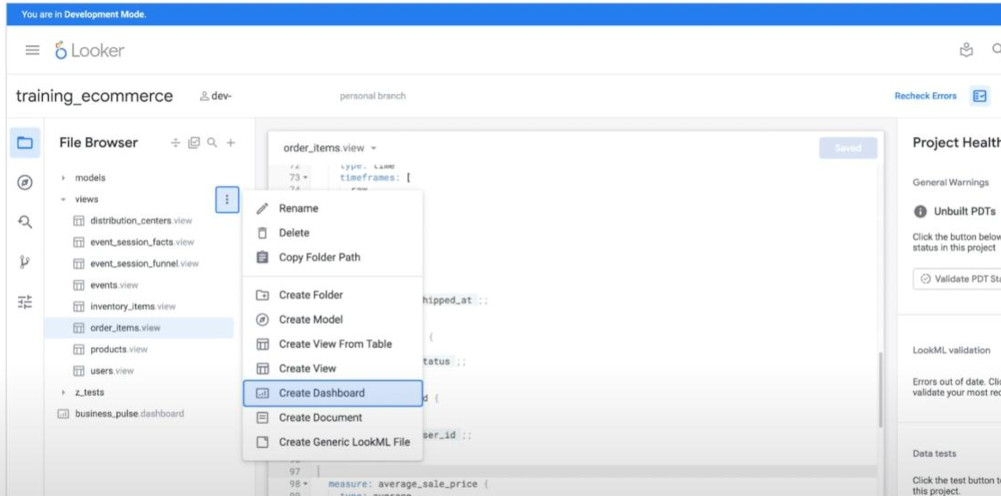
Dashboard: there are 2 types of dashboard: new-user(personal) and general dashboards. To create a general dashboard, use “Views”, for a personal dashboard, select then insert (import) it into folder “My Folder”.
-
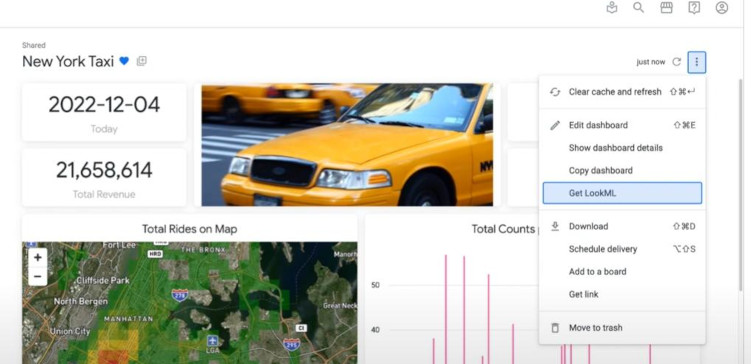
- How to get a code source of a dashboard
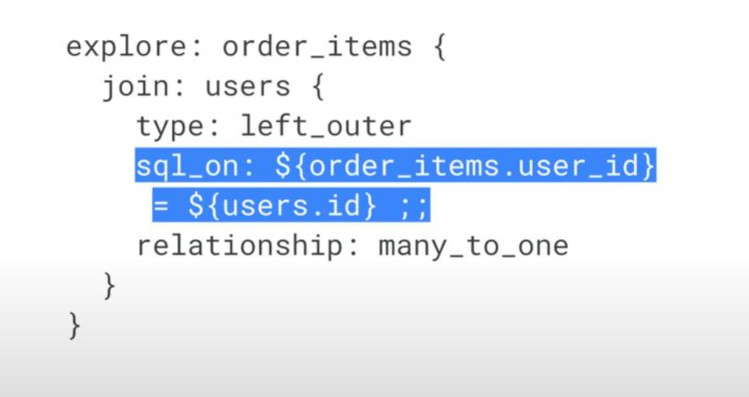
- Modelling a “NEW EXPLORES” (like “Flights” or “E-commerce”):
- It’s similar to creating a dimension or a measure.
-
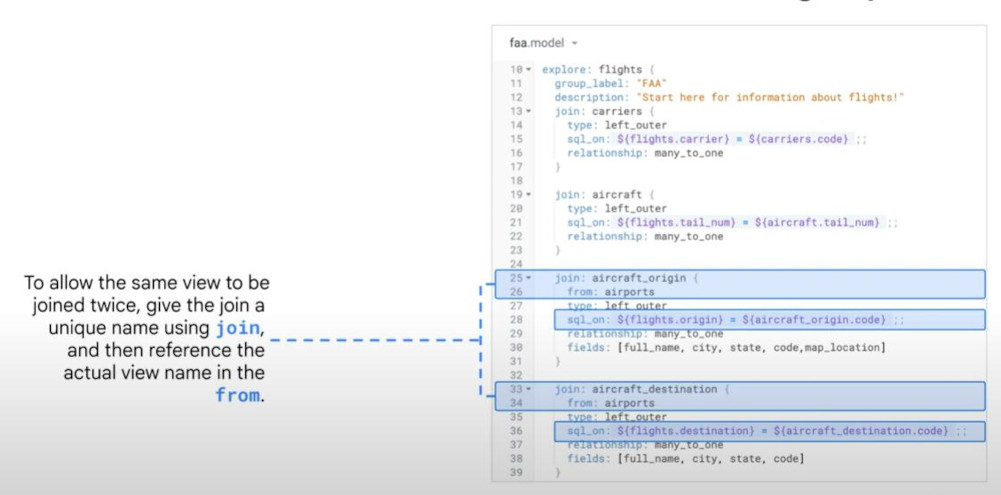
- Sometimes, we have to join multi-tables at the same time:
- Sometimes, we have to join one table many times, we have to use an unique alias-names (a medium), both of them reference to the same tables. For example: aircraft_origin & aircraft_destination basically refer to the same table “airports”.
- Indirect join (should not use), we can also join a new view to an existing another view inside an explore.
-
- Key filters in Explores there are 3 types:
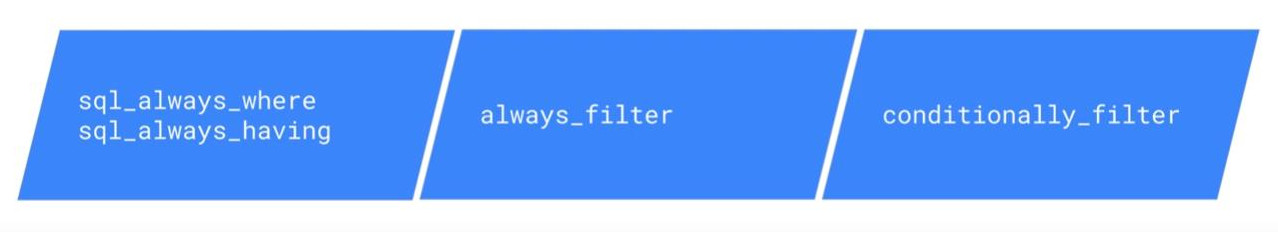
- sql_always_where & sql_always_having: this filter cannot be modified by business users and be invisible to business users unless they have permission. We can use this filter to show personal data like sensitive data.
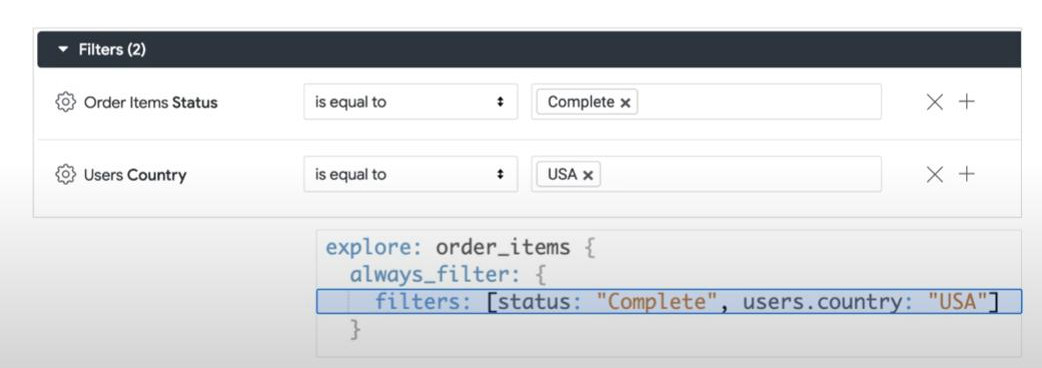
- always_filter : show up and be accessible and modifiable by business users, but they cannot remove the filter.
- conditionally_filter : these filters can be seen, modified and removed by business users.
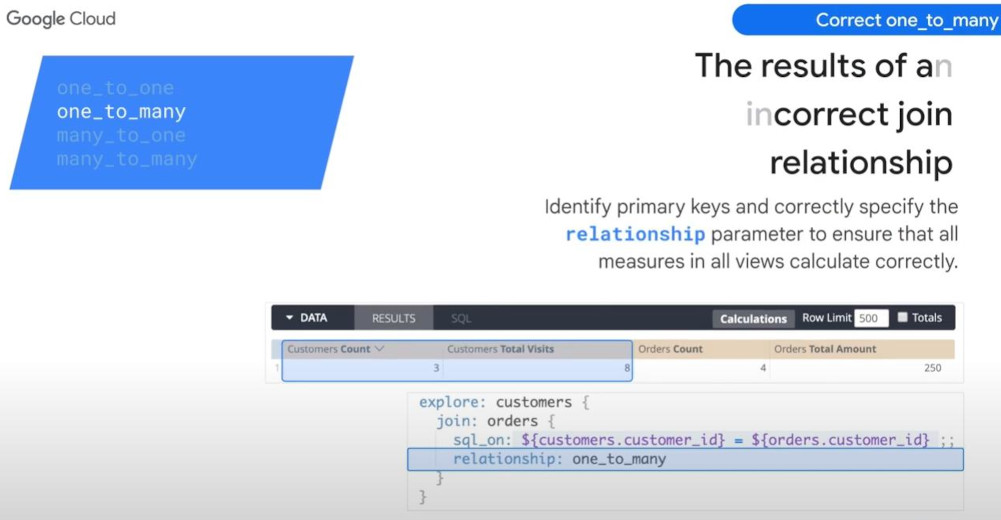
- Symmetric aggregation (count, …): we need to define the “join relationship” based on the primary key.
- Derived Tables:
- There are 2 types:
- a SQL derived table: created by a custom SQL.
- a NDT (native derived table): created inside LookML. (maximum reusability)
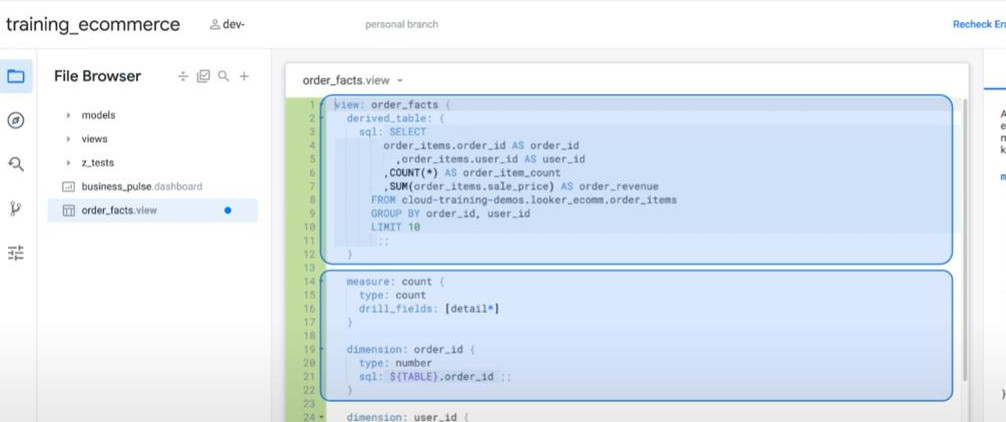
- Using a SQL derived table: enable “Development Mode” => “SQL Runner” => write a query to create a SQL derived table => Add to your project as a new View. We can also see back it inside “File Browser”. Some dimensions and measures can be auto-created by LookerML, we should check to hide them or modify them if necessary. (Warning: remove “LIMIT” in the query, and establish new “Primary-Key”)
-
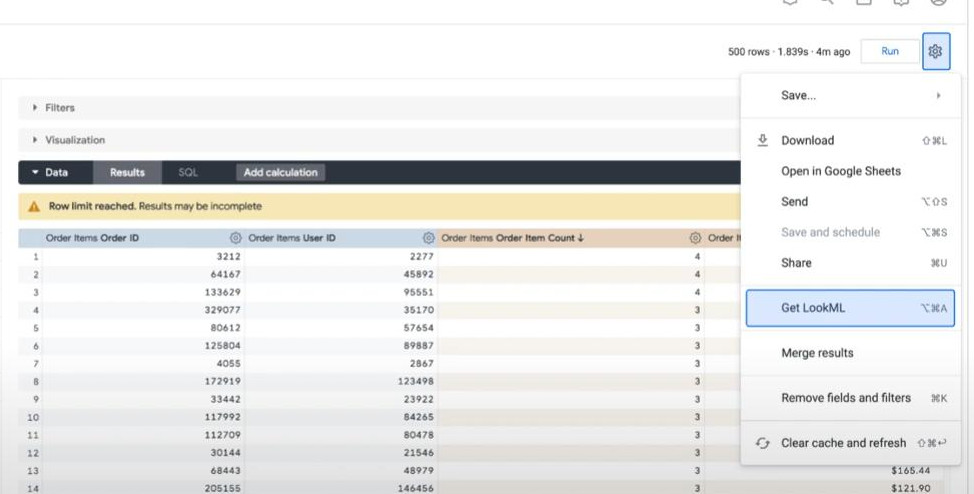
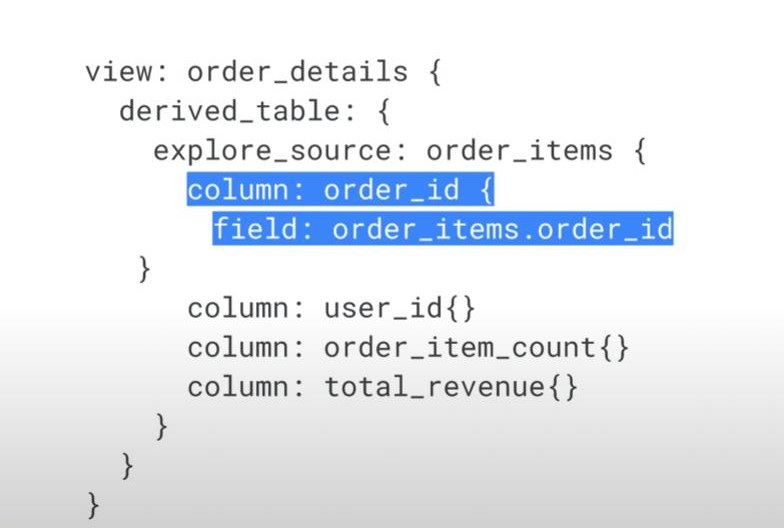
- For Native Derived Table (Development mode): we can take “its auto-generated ‘LookML code’” by clicking “Get LookML” > choose “derived table” tab > copy the “LookML code” > we can create a new VIEW with this LookML-code. We can add more dimensions into this code if we want.
-
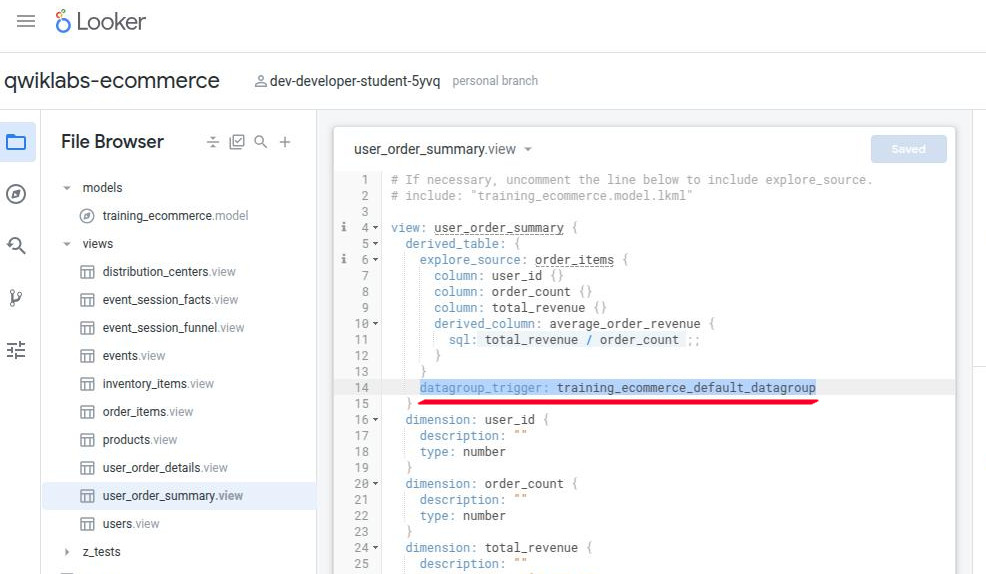
- Example of a LookML code:
- There are 2 types:
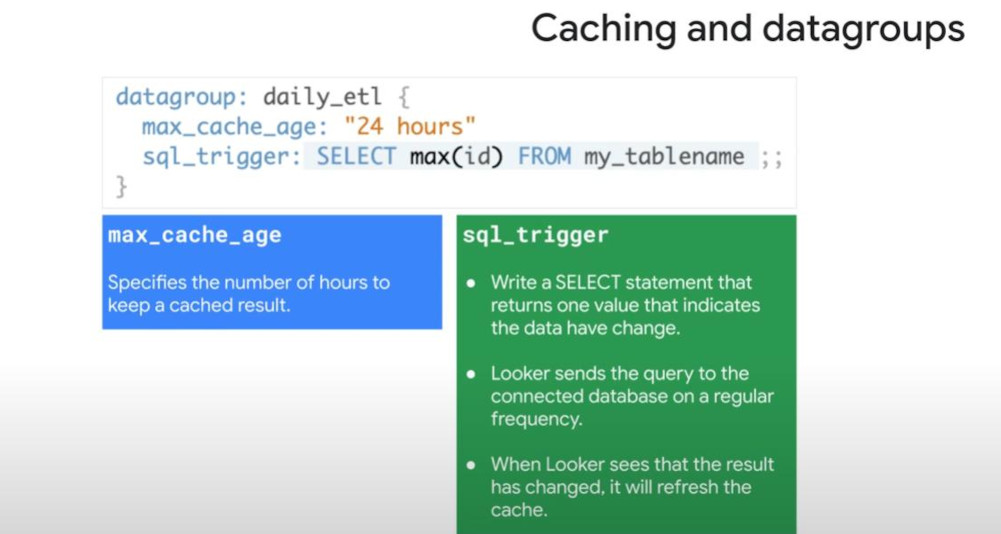
- Cache with datagroup: caching is triggered with “datagroup”
- Build a datagroup before enabling it. (sql_trigger runs be default every 5 minutes in Looker, set only by Admin)
-
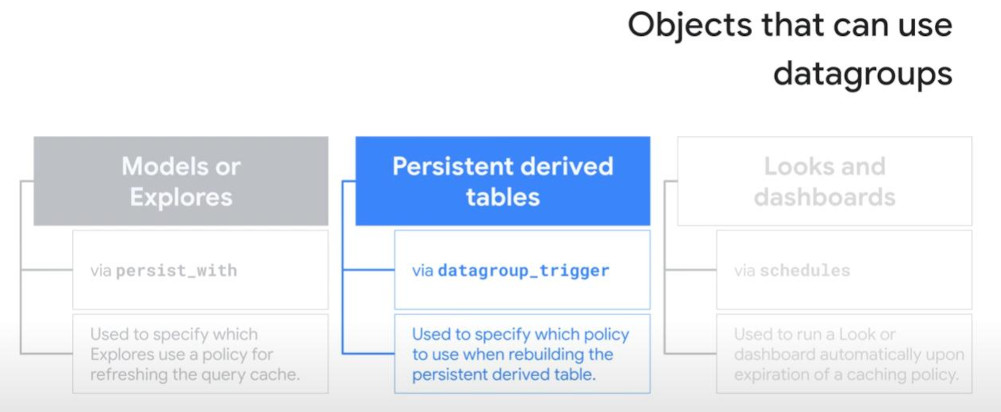
- Notice: Each objects (model & explore, PDT, Looks & dashboard) will have different ways to apply caching:
-
-
Persistent derived Table (PDT) : after creating a new PDT, this persistent derived table will be saved into the database for optimizing a query. The best-practice name for a PDT is “teach-scratch.xxxx.xxx”
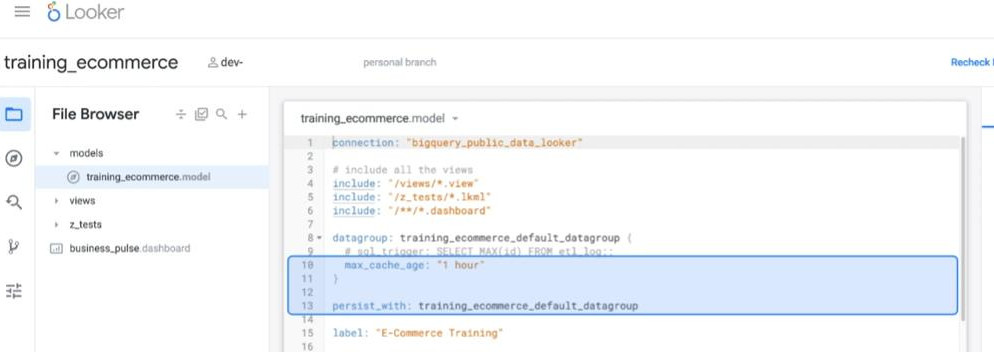
- Create and Apply datagroup in a model:
-
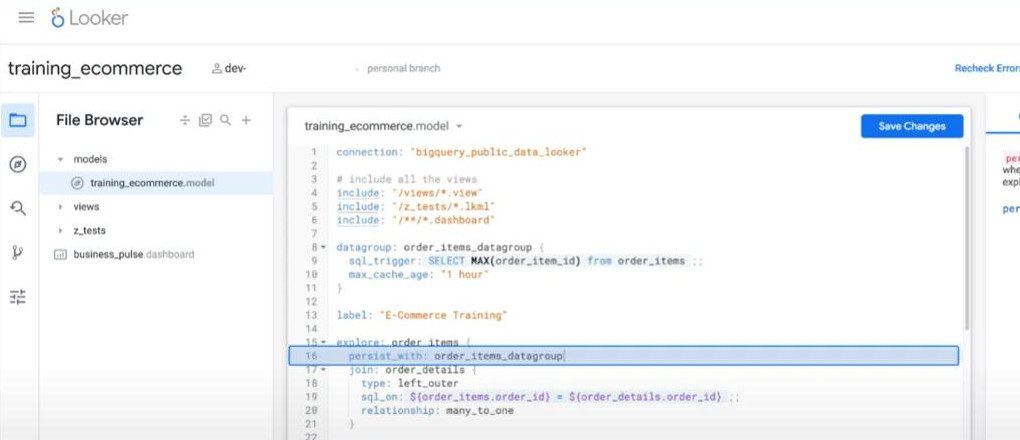
- Create and Apply datagroup in an explore “order_items”:
-
- Example to persist a derived table: (the “WITH” clause in the SQL will be replaced or removed because its medium table is persisted in cache already as adding the “datagroup_trigger”)
-
- Warning: “persist_with” cannot be used for OAuth (login by third parties like Google or Facebook) for BigQuery, instead using “persist_for”.
- Best Practices:
- description: “A value equal to Yes means that the order…”
- label: “Total Revenue Lost From Canceled Orders”
- hidden: yes
- fields: [ALL_FIELDS, -users.city, -users.email, -users.first_name, -users.gender, -users.last_name, -users.state] (inside an explore*)
- group_label: “Location” (both explore & dimension)