-
VISUALIZATION:
-
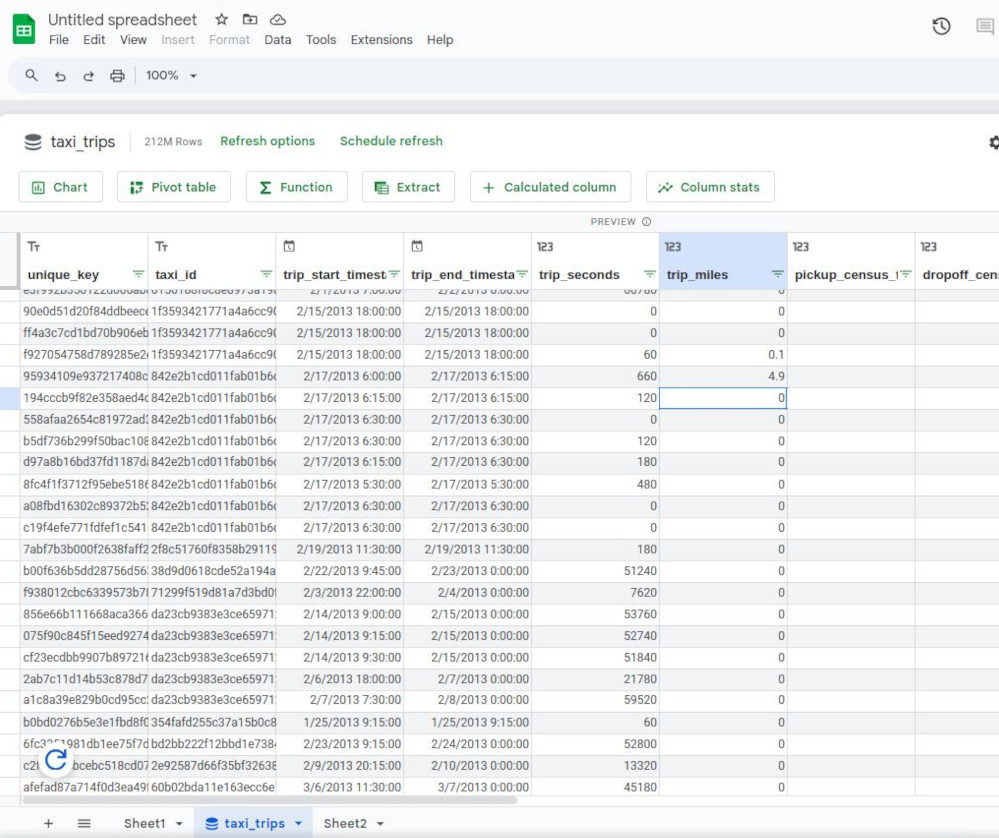
“Connected Sheets” brings you the power and scale of a BigQuery data warehouse to the familiar context of Google Sheets. You can analyze billions of rows and petabytes of data in Sheets without specialized knowledge of SQL.
-
Lab 1: Connected Sheets: Qwik Start
- Task 1. Open Google Sheets
- Task 2. Connect a Google sheet to a BigQuery dataset
- Task 3. Formulas
- Task 4. Charts
- Task 5. Pivot tables
- Task 6. Using Extract
- By default, Connected Sheets shows a preview of 500 rows of raw data in BigQuery. To import more data into Connected Sheets, you can use Extract.
- Task 7. Calculated columns (a new column in to a table)
- Task 8. Refresh all / Scheduled refresh
-
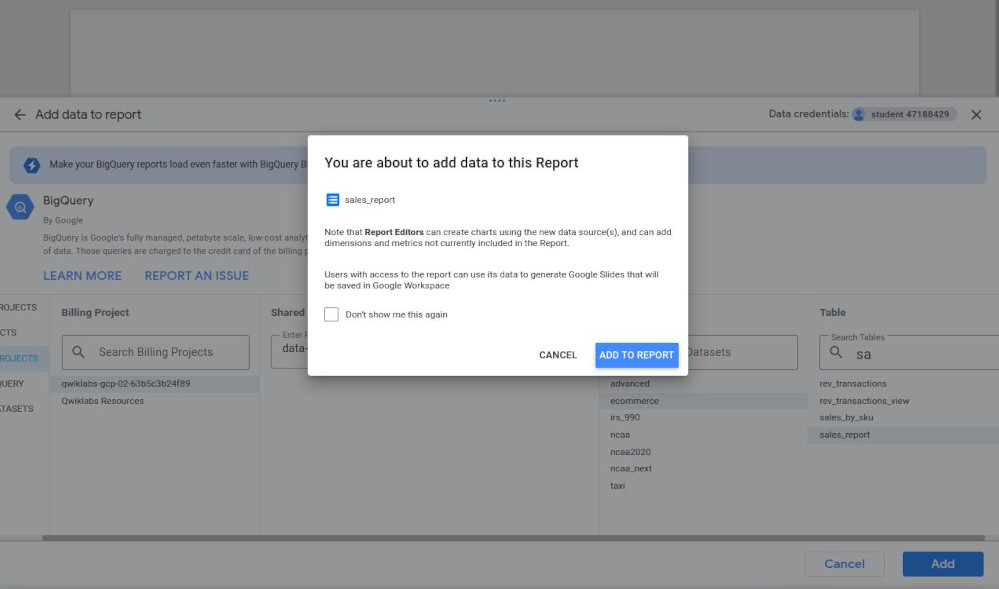
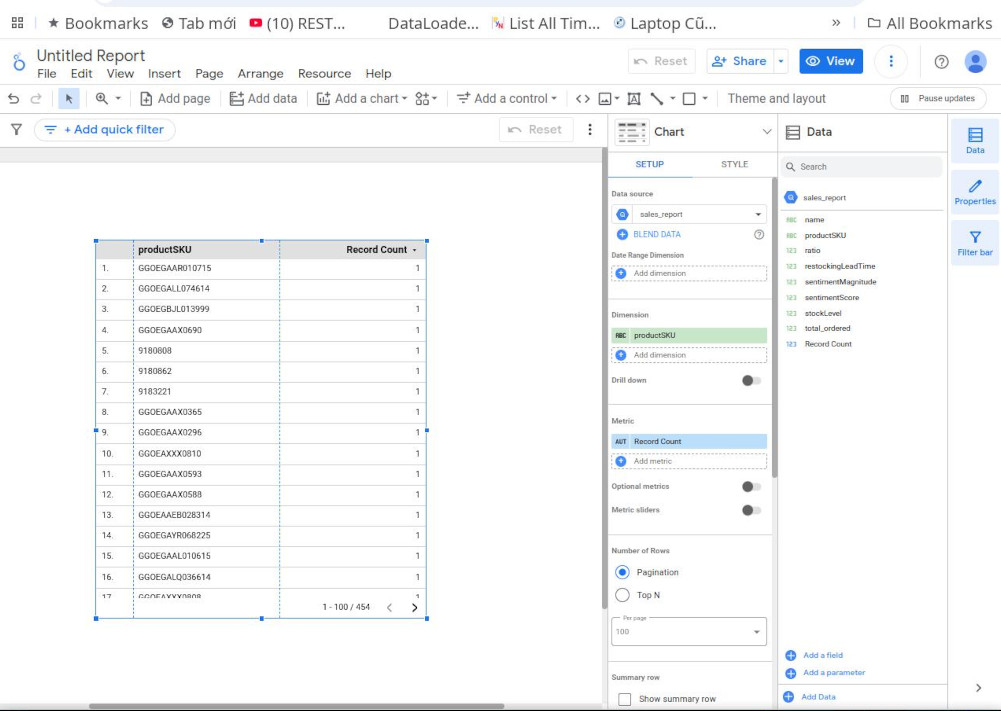
Lab 2: Explore and Create Reports with Looker Studio
-
Task 1. Launch Looker Studio and create a blank report Looker
-
- Task 2. Customize a report: dragging is very useful here.
-
-
- Scalable data-transformation data pipeline:
-
What is a “Dataform”: it is a serverless framework to develop and operationalize “data transformation pipeplines” in SQL.
-
Lab 1: Create and execute a SQL workflow in Dataform.
- Task 1. Create a “Dataform repository”:
- Dataform service account: “service-302427936878@gcp-sa-dataform.iam.gserviceaccount.com”
-
Task 2. Create and initialize a “Dataform development workspace”
- Task 3. Create a SQLX file for defining a view
-
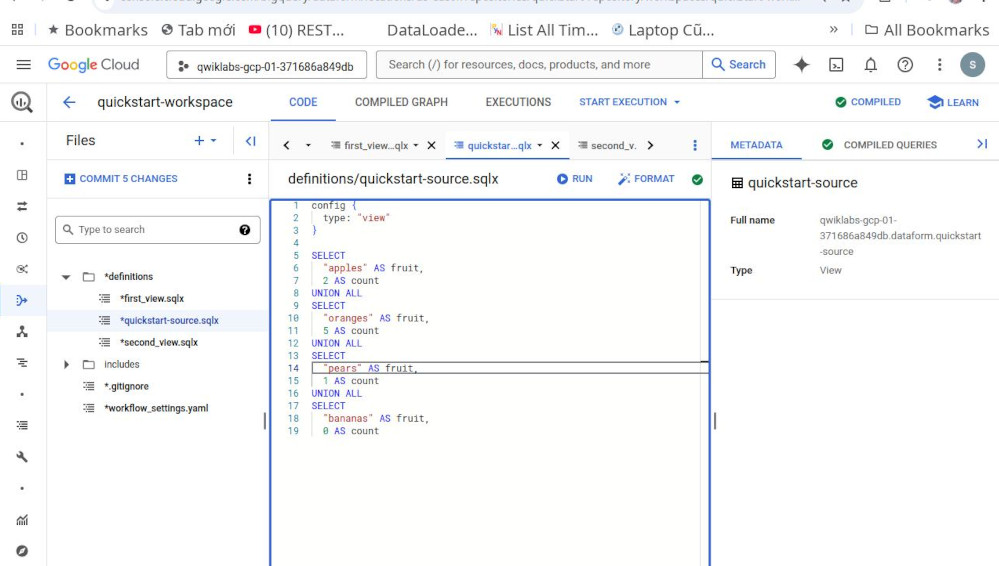
-
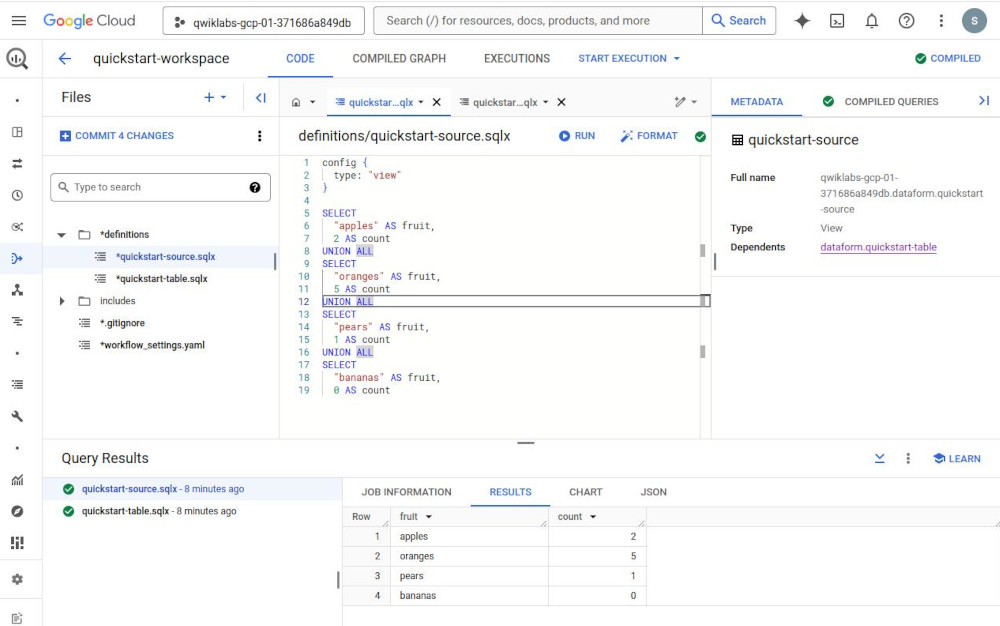
Task 4. Create a SQLX file for table definition
-
Task 5. Grant Dataform access to BigQuery
- Task 6. Execute the workflow
- Task 1. Create a “Dataform repository”:
-
- BigQuery Studio:
- Python notebook is available in BQ.
- BigQuery Dataframe for Data Science Tooling.
- Dataplex: Data profile & Data Quality & Data Lineage.
-
Dataform version.
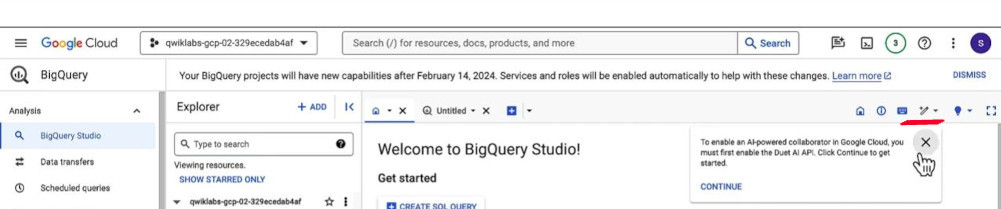
- Duet AI in Google Cloud
-
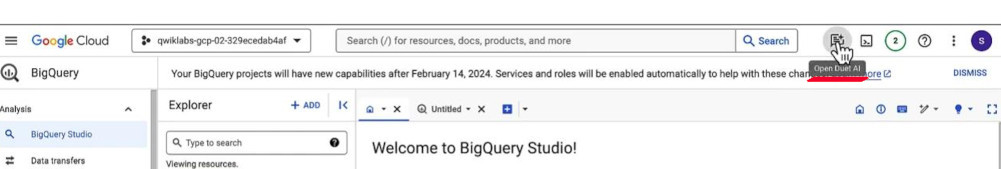
- Duet AI in BigQuery SQL
-
- Python Notebook: how to open:
- W1: Cloud Console (☰) => “Vertex AI” => “Colab Enterprise” => “Enable” this API => create a new Notebook “N1”
- W2: Back to BigQuery => Now we can create a new notebook here directly because we have just enabled it (require same region). Also, we can see the notebook “N1” by expanding the project
- Lab 1: Analyze data with Gemini assistance
- Activate Cloud Shell
-
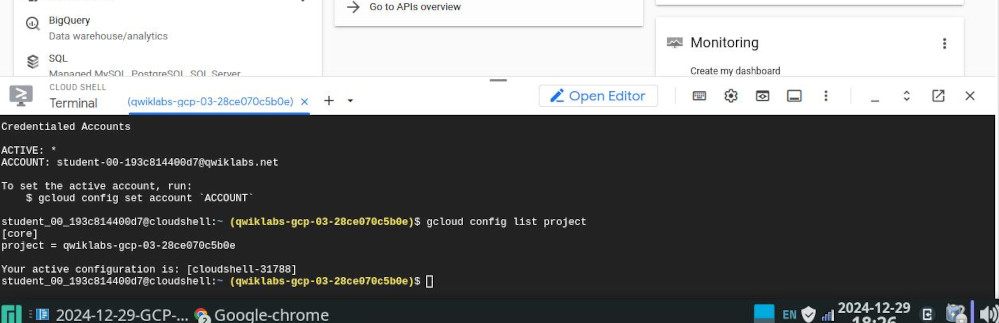
- Task 1. Configure your environment and account in Cloud Shell (too complex).
-
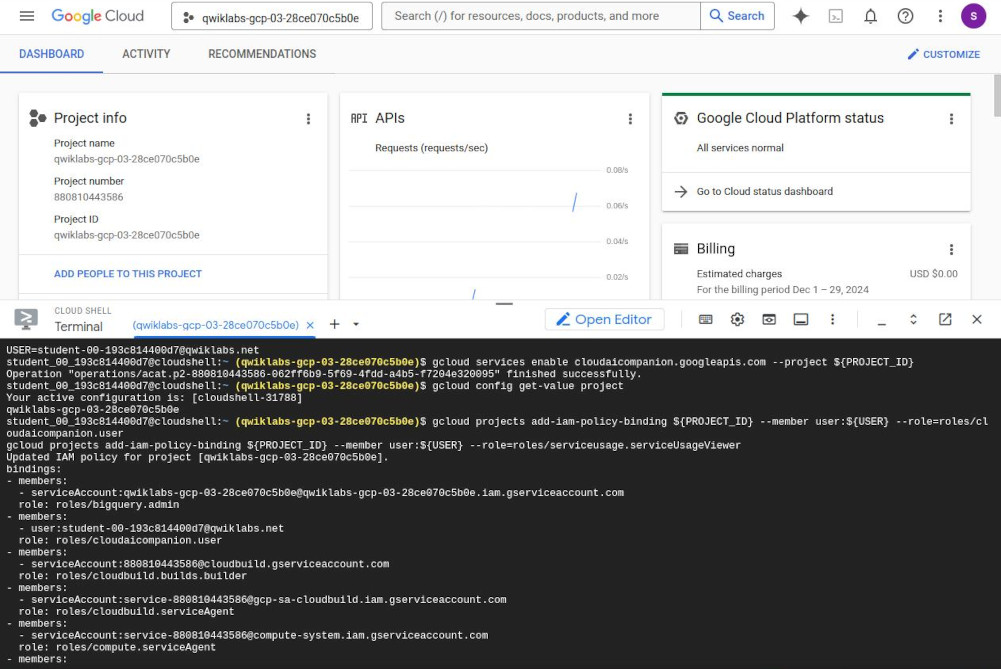
-
Task 2. Create a dataset and enable Gemini features in BigQuery
- Task 3. Use Gemini to analyze your data
- Ask by chatting with Gemini
- Task 4. Prompt Gemini to explain SQL queries in a sales dataset
- Task 5. Generate a SQL query that groups sales by day and product
- Type “#sql explanation prompt”
- Press “Enter” to run AI gemini
- Press “Tab” to accept the SQL results
-
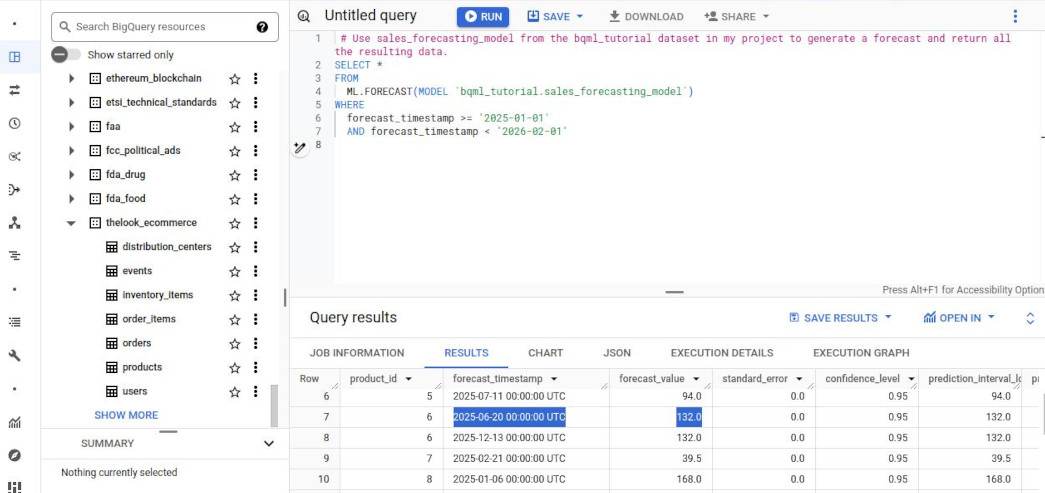
Task 6. Build a forecasting model and view results
-
CREATE MODEL bqml_tutorial.sales_forecasting_model OPTIONS(MODEL_TYPE='ARIMA_PLUS', time_series_timestamp_col='date_col', time_series_data_col='total_sales', time_series_id_col='product_id') AS SELECT sum(sale_price) as total_sales, DATE(created_at) as date_col, product_id FROM `bigquery-public-data.thelook_ecommerce.order_items` AS t1 INNER JOIN `bigquery-public-data.thelook_ecommerce.products` AS t2 ON t1.product_id = t2.id GROUP BY 2, 3; -
Note: this query creates a time series forecasting model that uses historical sales data from the order_items table, grouped by date and product, to predict future sales for each product. The model utilizes the ARIMA_PLUS algorithm, which is well-suited for analyzing and forecasting time series data.
-
# Use sales_forecasting_model from the bqml_tutorial dataset in my project to generate a forecast and return all the resulting data. SELECT * FROM ML.FORECAST(MODEL `bqml_tutorial.sales_forecasting_model`) - Note: The forecast results is from the sql above with “forecast value” of total_sales the year up to 2030.