
Looker is to support Data Analysts for better visualization.
Lab1: Task 2: Visualize dimensions and measures
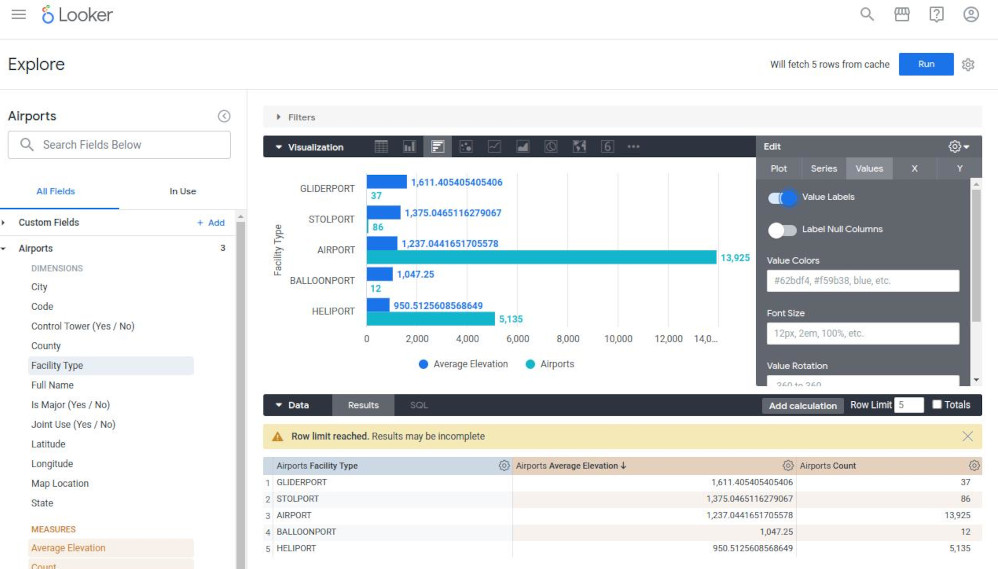
- Click “Explore” => “Airport” data => Dimensions: “Facility type” => Measures: “Average Elevation”, “Count”:
- set Row limit to 5
- Visualization: click “Values” => enale “Values label”
- Visualization: click “Y” => drag “Airports” under “Top Axes”. “Average elevation” remains under “Bottom Axes”.
- Visualization: under “Configure axes” => Bottom 1, enter “Count” into box “an Axis name”.
- “gear icon” next to button “Run”, and select “Save > To an existing dashboard” => name the visualization “Average elevation by facility type” => New Dashboard “Airports/Flights” => OK, save.
Lab 2: Filtering and Sorting Data in Looker
- Task 1: Filter on Dimensions
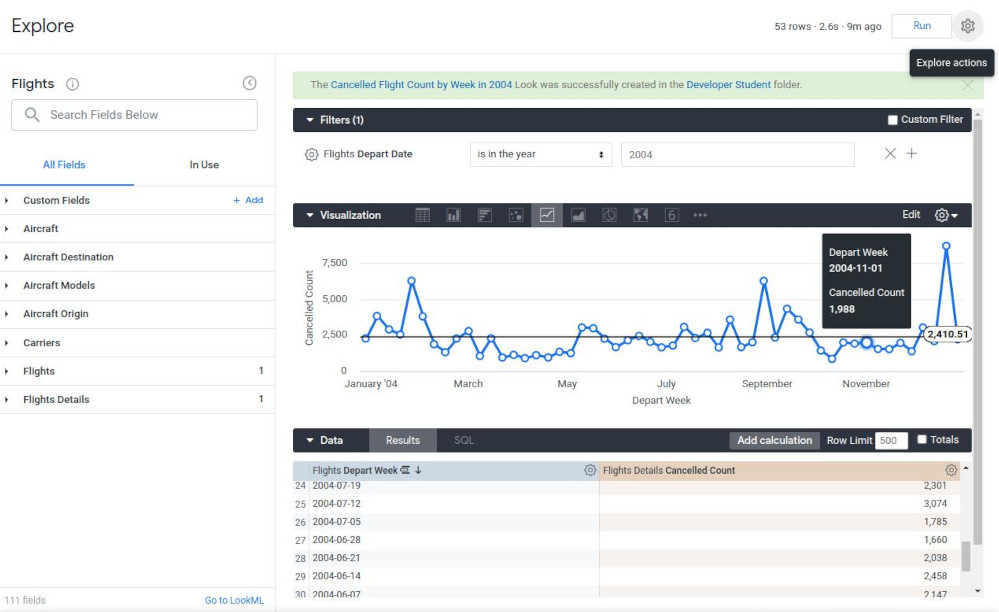
- Task 2. Filter on Measures
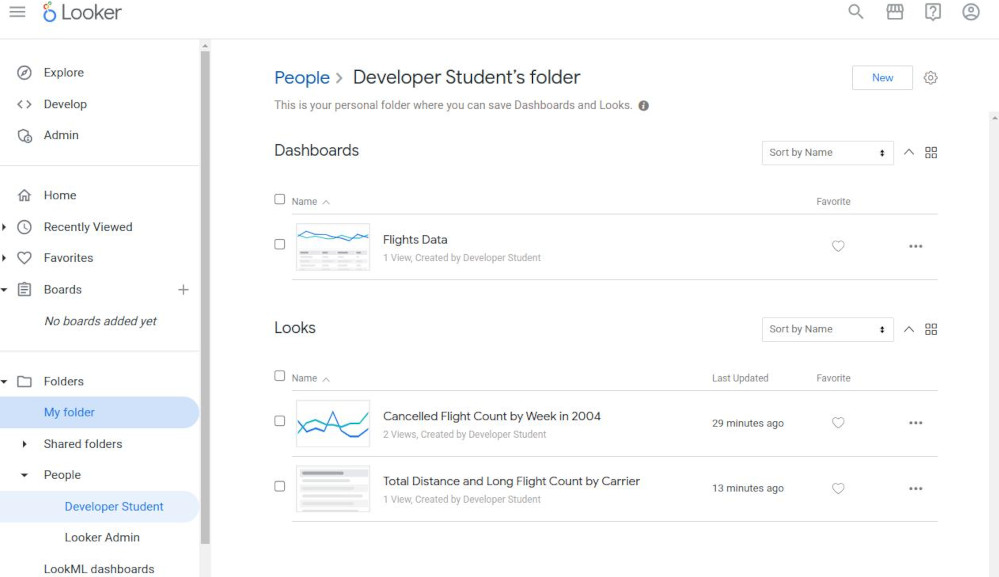
- Task 3. Add Looks (files) to a dashboard (“My Folder” will contain everything)
Lab 3: Merging Results from Different Explores in Looker
-
Task 1. Create a primary query: once create the primary query, we can add another source query. Continue directly to task 2.
- Task 2. Add the next source query: “Gear” icon => “Merge results”. Now a new window appears and we can build the new query to be merged into the primary query.
- Be sure that both queries contain at least one common dimension whose values can be matched exactly.
- Task 3. Check the merge rules and run the merge
- Looker automatically finds the best dimensions to use for matching the queries and displays these matches in the “Merge Rules” section
- Task 4. Edit the merged results:
- We still have the flexibility to re-edit the merged queries and the rules used to merge the queries
- Click “gear icon” next to a label “Primary” on the left side in Queries list.
- Task 5. Save your merged results to a dashboard.
- Save to Dashboard, add title, create a new dashboard.
- The file is saved in the “shared folder”.
Lab 4: Looker Functions and Operators
- Task 1. Pivot dimensions
- Rule: when you pivot one dimensions, each value in the dimension will become a column, reducing the need to scroll down to find data.
- “Pivot button” and “Filter button” lies right besides the “dimensions” or “measures”.
- “Legend” in chart is an explanation for a line or a bar in chart.
- Task 2. Reorder columns and remove fields
- After removing the column by the “gear icon” at the column name, we should re-run again.
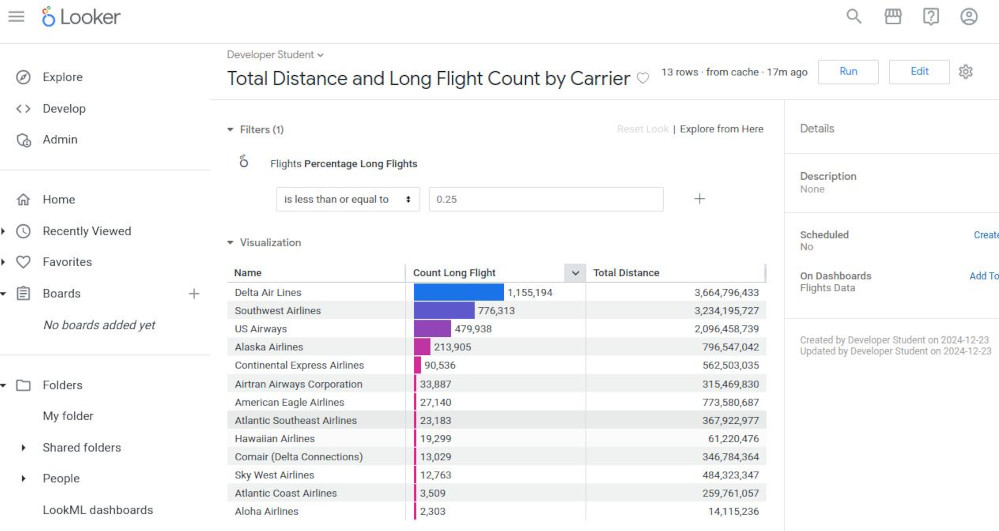
- Task 3. Use table calculations to calculate simple percentages
- We can hide a col from visualization chart by the “gear icon” at the column name.
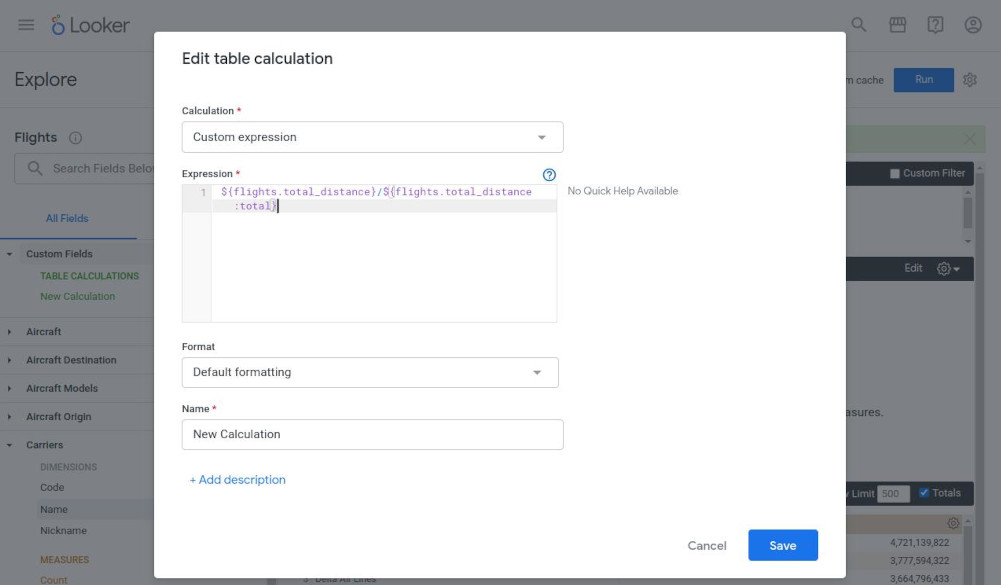
- Task 4. Use table calculations to calculate percentages of a total
- We can add a table calculation to a new column by clicking “custom field”, add expression “${flights.total_distance}/${flights.total_distance:total}”, naming and saving.
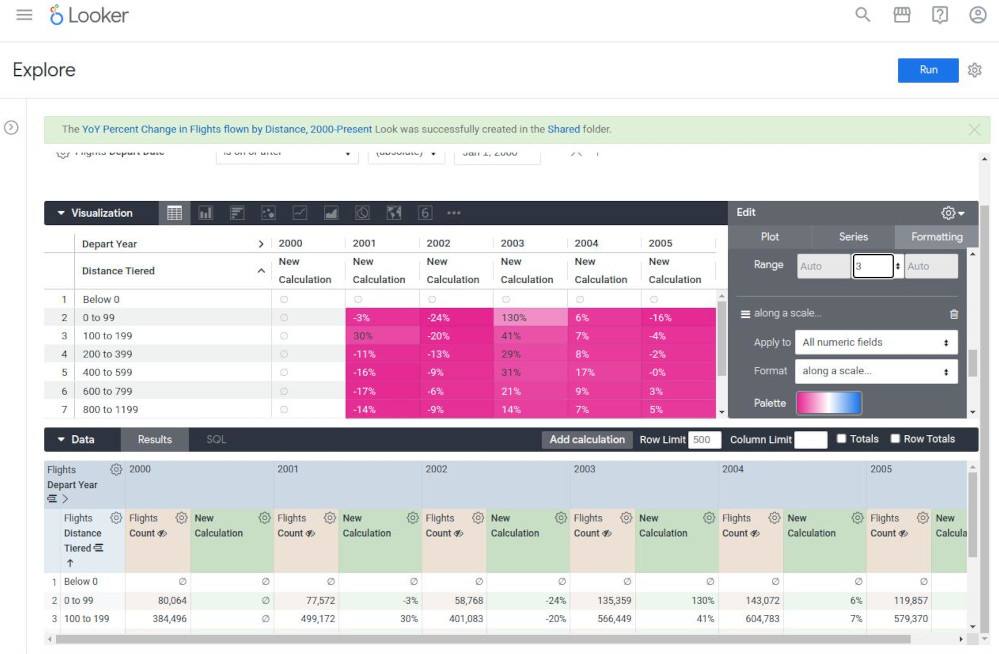
- Task 5. Use functions in table calculations
-
making use of the “pivot_offset” function in the expression: (${flights.count}-pivot_offset(${flights.count}, -1))/pivot_offset(${flights.count}, -1)
-
“Enable Conditional Formatting” can use to highlight a table cells based its values lower or higher.
-
Lab 5: Prepare Data for Looker Dashboards and Reports: Challenge Lab
-
Challenge scenario: You are a data analyst intern for a private plane and helicopter rental company. For your first assignment, your new manager has tasked you with creating multiple dashboards to present at a company meeting. Specifically, you are required to use the provided FAA datasets to determine the best locations to set up new rental hubs.
-
Need to answer to the following questions:
- Quest 1. Which “states and cities” have the most airports with heliports?
- Quest 2. What is the facility “type breakdown” (phân loại) for the “states” with the most airports?
- Quest 3. What are the “airports and states” with the highest percentage of flight cancellations with over 10,000 flights?
- Quest 4. Where are the busiest, joint-use major airports that have control towers and what are their “associated codes” (mã số)?
- Quest 5. What are the origin and destination airports with the smallest average distance between them?
Keep practising