
A. OVERVIEW
Hi, My name is Diane and Mr.Tate is my data scientist. We work a digiatal company called “Data Beans”. We sold business challenges for clients with data and AI.
Our new client is “Coffee on Wheels”. They sell coffee on food trucks and operates across cities globally.
WE HELP THEM TRANSFORM OPERATIONS BY USING DATA AND AI:
We’ve recently meet Bea, a manager at Coffee on Wheels, to understand the business requirement. Bee envisions a captivating dashboard for the future of food trucks which achieve three main goals:
- ENHANCE SALES:
- Identify top and underperforming menu items.
- Suggest innovative replacement.
- MANAGE CUSTOMER RELATIONSHIPS:
- Analyze customer reviews.
- Generate proper feedback.
- OPTIMIZE TRUCK LOGISTIC:
- Determine real-time truck locations (based on weather, events, traffic, customer preferences).
- Equip every truck with an “intelligent GPS”.
So, we have 3 common CHALLENGES:
CHAL 1: EXPLORE & PREPARE DATA.
CHAL 2: ASSIST CODE DEVELOPMENT.
- Code generation.
- Code explanation (ohne judgement).
- Code review and optimization.
- Code debug and suggestions.
CHAL 3: DISCOVER & VISUALIZE WORKFLOW.
- Workflow visualization.
- Data discovery.
- Query generation.
- Insights creation.
GEMINI USES AI TO HELP WITH 2 TOOLS:
Tool 1: Insights.
Tool 2: Table Explorer.
B. PRECAUTIONS AS USING GEMINI:
- Single tables only (not for joining tables)
- Simple queries only (WHERE ok, but cannot WHERE…AND… )
C. LET’S START A LAB:
- For exploring data:
- Gemini suggests some tasks on a side bar (filter,…).
- Use natrual language prompts (text input in SQL like #show me top 2 orders).
- For data pipeline:
- Gemini enhances ETL speed (extract, transform, load) significantly.
- Quickly visualize the data pipeline in a graph.
- Lab practice:
- Task 1: Generate data “insights” on the order item table.
- Task 2: Use “table explorer” to review details of the location table.
- Task 3: Query the order item table without code.
- Task 4: Review the menu and order tables.
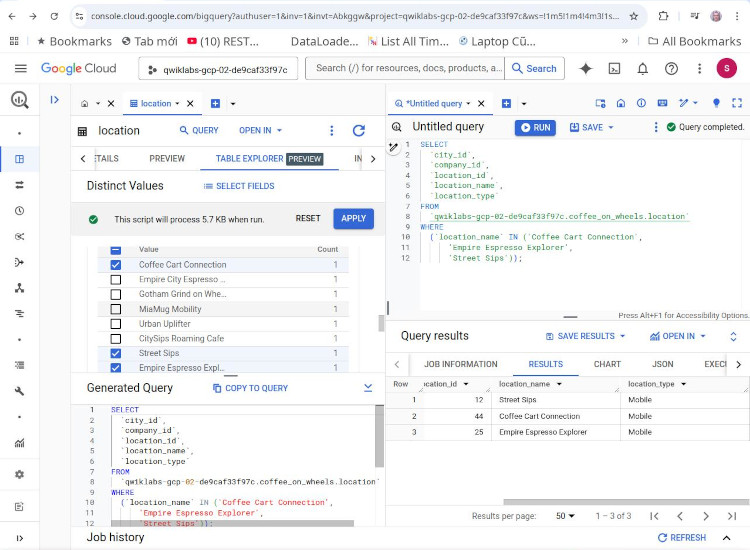
Figure 1: Table-Explorer on “Coffee on Wheels”
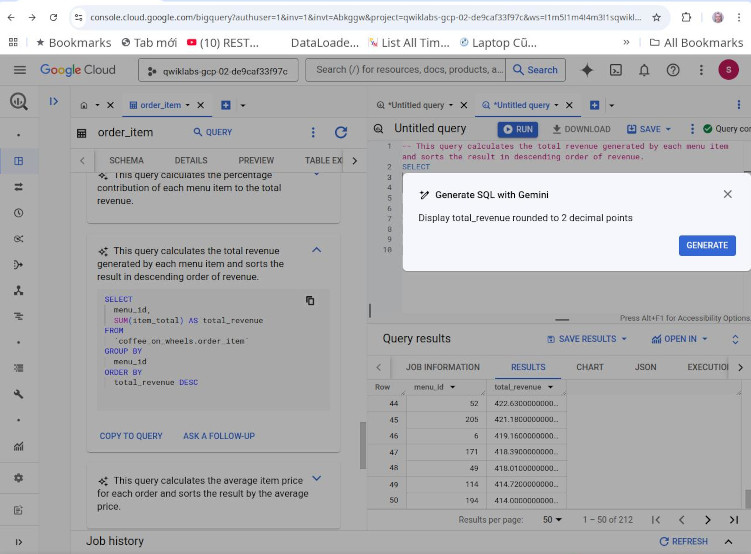
Figure 2: Insights & Gemini Prompt on “Coffee on Wheels”
D. CODE ASSISTANT (or USING PROMPT):
There are 2 ways to use Gemini Prompt:
- W1. Press button on the left with some stars on it.
- W2. Typing directly with “#” at the beginning: #display 2 items of best selling.
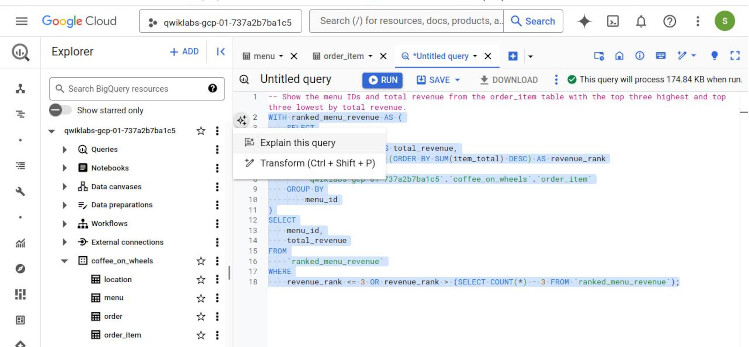
How to modify (transform) a query:
- Step 1: select all the query that needs modification
- Step 2: Press the stars-on button, select “transform”, add prompt.
Gemini can also have a feature “explain code” like a personal SQL tutor as following image:
Rules to make questions
- Rule 1: Clarity is the key, not general. (clarity)
- Rule 2: One question at a time.
- Rule 3: clear instructions. (explicitness)
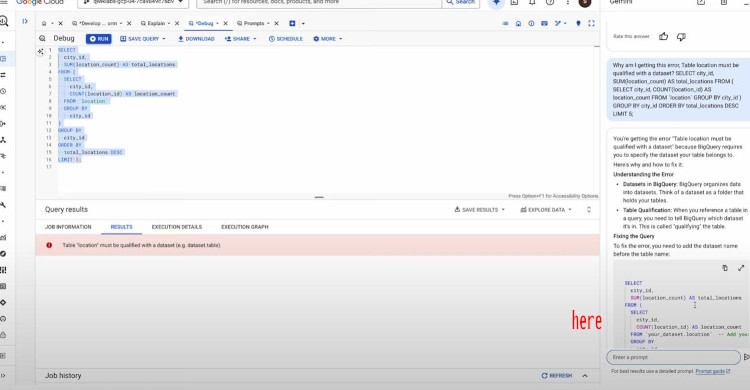
E. WHAT ABOUT TROUBLESHOOTING:
Gemini offer 3 features: “review code”, “debug code”, and “optimize code”. For using these features, just ask and add your code directly into the prompt on the right bottom as following image.
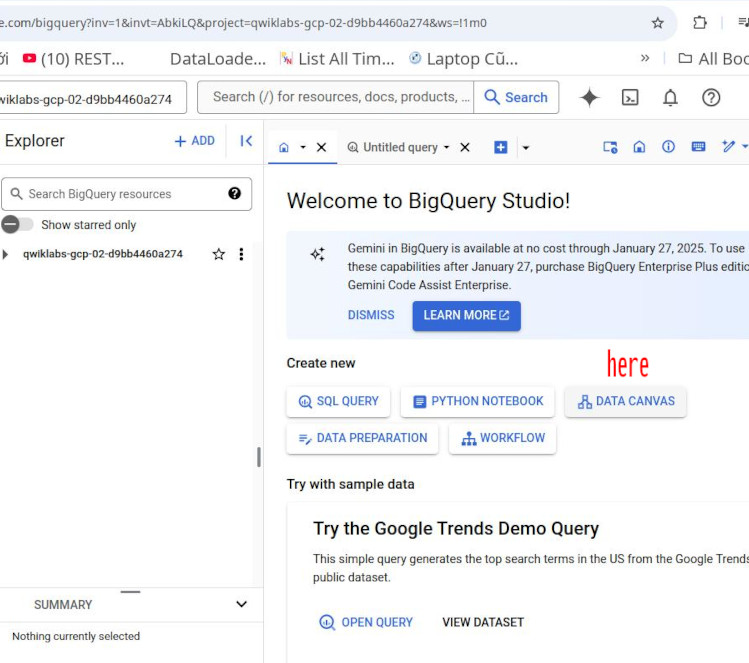
F. DATA CANVAS
“Data canvas” is an Gen-AI-powered tool. It has 5 primary features:
-
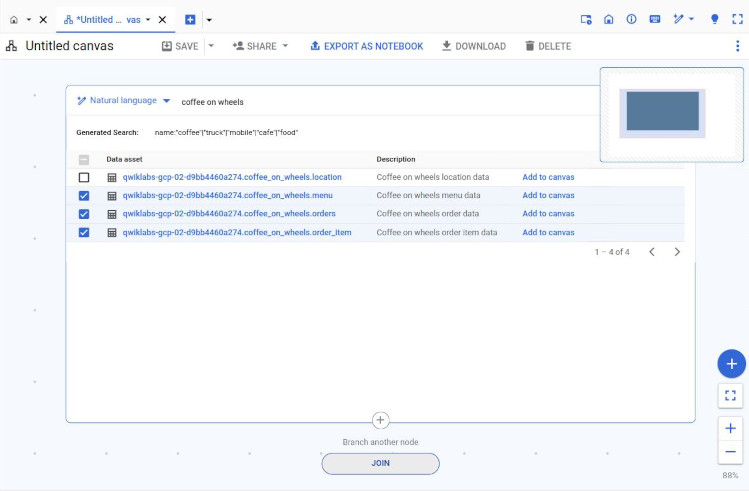
Featr 1. Find data: can search data or tables with either “Natural language” or “keywords”. Then, add results to the “canvas”.
-
Featr 2. Generate code by using prompts.
-
Featr 3. Create insights with charts, adding summary.
-
Featr 4. Visualize workflow, can modify; adding new tables, joins tables. (This eliminate the drawback as asking prompt directly ususally get improper queries).
-
Featr 5. Share and collaborate. Save (CSV, PNG) and export (to Looker Studio).
LAB OF “Data Canvas” tasks:
- Join the menu, orders, and order item tables.
- Calculate the total revenue for all menu items in 2024.
- Create a bar chart displaying the top 10 items by total revenue.
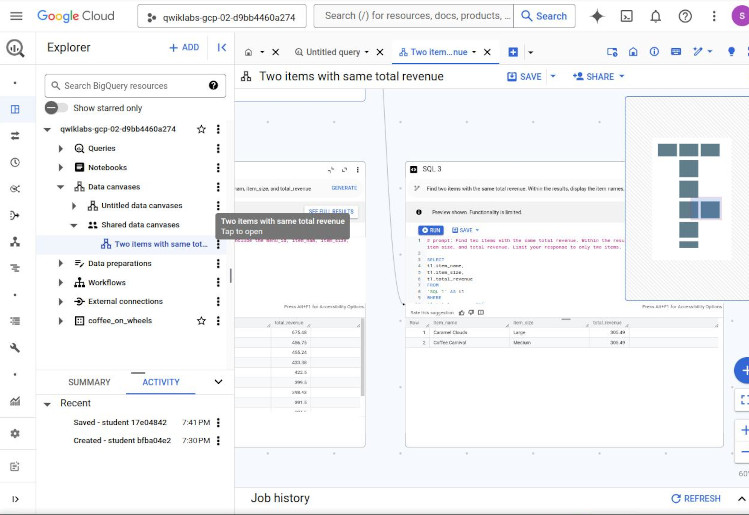
- Identify two menu items generating the same revenue.
- Collaborate with others.
Open the data canvas
Join 3 tables (it’s not automatic, we have to add a prompt to generate a SQL, then run it).
After joining, we have 3 btns:
- QUERY THESE RESULTS: can be used to create a query from the resulting joined table.
- VISUALIZE: can be used to create charts from the data in the joined table.
- JOIN: can be used to join this table with another table.
- GENERATE INSIGHTS: is to create a summary.
NOTICE AS SHARING:
- Step 1: have to “save as” before sharing (saved name: “Two items with same revenue”)
- Click btn “EXPORT AS NOTEBOOK”, instead of btn “SHARE”.
- List of users can be seen in “IAM”.
- Other users can see this sharing as expanding the project_id (Explorer) => expand “Data canvases” => expand “Shared data canvases” => see the file “Two items with same revenue”, click to show it.
G. CONCLUSION :
- This is only the beginning of using Gemini to bootst your productivity in BigQuery. There are still like using Gemini in Clustering, SQL enhancement, Operations.