
After 1 day consideration and consulting AI, as a newbie but old developer with many years working as a sales executive. I decided to plan my GCP flow like this: Data Analyst -> Data Engineer -> Machine Learning. I intend to finish Data Analyst in one week. Let’s start.
-
Day 3: Looker : making a data-driven decision with “Looker”
LOOKER HELPS:
- Visualize data,
- Answer questions as having data,
- Stay up-to-date,
- Make data-driven decisions.
DIMENSIONS & MEASURES:
- Since you identify your questions and the data you need, you need to combine “Dimensions” & “Measures” to find the answers.
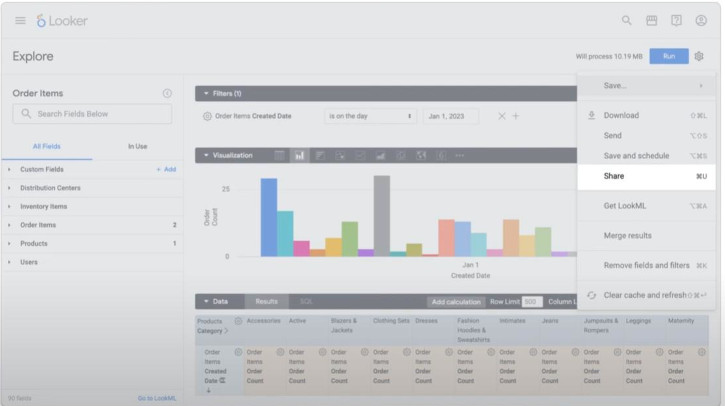
EXPLORE:
- An “explore” is a interface in Looker for asking questions. (LookML template)
- “Explore” contains “Dimensions” & “Measures” in field “Distribution Center”.
- “Dimensions” are attributes or characteristics of data. Each column in data table is one dimension or one feature of the data.
-
“Measures” are calculations performed across multiple rows of data.
- Main components: “Data”, “Visualization”, “Filter”, and “Pivots”
- “Data” is the data you need.
- “Visualization” is the chart.
- “Filter” applies on both “dimensions” & “measures”. “Filter” does not delete any of the “Data”.
- “Pivots” is a matrix of data. For ex, group your customers data by age. Pivot’s useful to make “unique rows in a column become columns”
LOOK (files):
- When you save, “explore” will create “a single report” called a “Look”
- Many “Look” can be added to “Dassboard” like “all-on-one-place”.
- 3 parts “Explore”, “Look”, “Dashboard” can be shared.
PRACTICE missions:
- Use Explore interface to access data published by LookML.
- Work with Dimensions and Measures to query and select data.
- Best Visualization
- Save to create a Look (an explore query), then added into Dashboard.
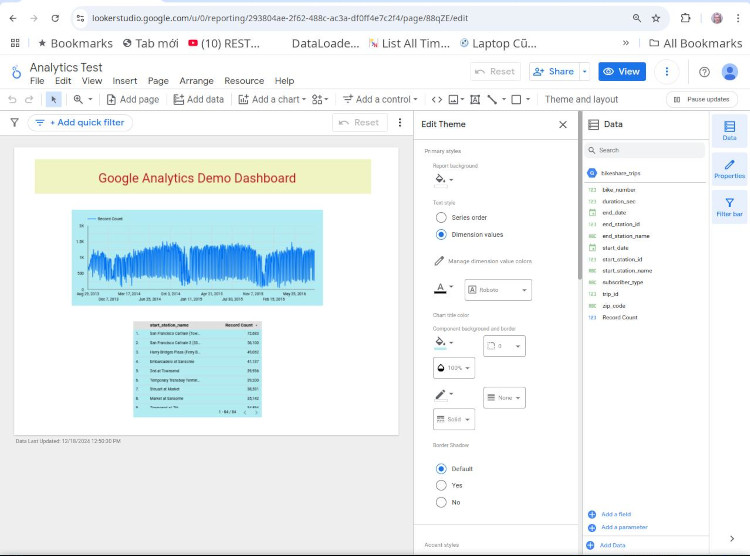
LOOKER STUDIO: lookerstudio.google.com
-
“Looker studio” focus on useability and data visualization while “Looker” focus on analyze and report.
-
“Looker studio” helps publish reports on web and embed reports in other applications.
LOOKER STUDIO FEATURES:
- A drag and drop interface.
- Various types of reports.
- Real-time collaborations on reports.
- Security feature that set who can collaborate.
LOOKER CONNECTORS:
- connect any “looker” instance and “looker studio” instance to make a report.
- There are many connectors in Looker.
- To use a specific connector, we must enable it in Looker instance before saving.
PROPER QUESTIONS:
- What type of data you need?
- What insights to communicate?
- Who is the audience?
TYPES OF CHARTS:
- Bar chart: fit to compare data across different categories.
- Line chart: fit to show changes over time.
- Area chart: similar to Line chart.
- Pie chart: useful to show the relative proportions of different categories.
- Donut chart: similar to Pie chart.
- Scatterplot: fit to show relationship between two variables.
- Heatmap: fit to show distribution of data.
PRACTICE:
- Create a new blank report.
- Create a new connection and data source.
- Add a time series chart.
- Style the report.
- Add a banner to the report.
- Add a title to your report.
SHARING REPORTS & DASBOARDS:
- Data can be shared from both Looker and LookerStudio.
- Looker shares via collaboration.
- Drawbacks of Looker sharing
- Looker is a paid platform.
- Not easy-to-use,
- Possibly vulnerable (easy to be attacked) because Looker shared data directly from Cloud, although there are some accessment control.
-
Looker is good for scheduled reports (e.g, delivery every Friday). (Note: both Looker and Looker studio has “scheduled report feature”.)
- Benefits of Lookerstudio:
- ease-of-use,
- Can embed in web or app.
- better permissions for different types of data. (view or edit permission)
- not full-control compared to Looker: no Machine Learning or data modeling.
- So, which, looker or lookerstudio:
- Looker: fit for powerful and scalable platform required.
- Lookerstudio: just sharing
- Looker sharing ways:
- Lookerstudio build on top of Google Drive with same similar sharing via “shared button” with 2 permissions: “view” and “edit”.
-
Day 2: Objectives (GC - Google Cloud)
- OBJECTIVES:
- Data analytics workflow on GC and types of GC analytics.
- Data analytics products on GC and how it works with data.
- Data sources, data structures, data storage options in GC.
- Use BigQuery, Looker, and Looker Studio to answer data questions and influence business decisions.
- LIFE CYCLE OF DATA ANALYTICS:
- Data Life Cycle:.
- Compare and contrast data sources and storage methods on GC.
- Compare data types used for Data Analytics versus Machine learning.
DATA FLOWS:
- Data is the key to unlock the AI.
- Data sources input: operational system, web sources, social media, internet of things (IoT).
Step “INGEST”: to break down “data silos”, we have 4 tools.
- Pub/Sub: streaming services are for ingesting and messaging.
- Dataflow: for analytics and processing.
- DataProc: to batch process data
- Cloud Data Fusion: cloud-first service, it’s code-free and ETL (extract-transform-load) data across “on-premises” (in-house system) and cloud sources.
Step “STORE”: options includes “databases”, “data lakes” and “data warehouses”.
-
Google storage products includes Cloud Storage, Cloud SQL, Cloud Spanner, Bigtable, FireStore, AlloyDB for Postgresql, and BigQuery.
- Relational Databases: Cloud SQL, Clound Spanner, AlloyDB for Postgresql
- NoSQL databases: BigTable and FireStore
- BigQuery is GC’s data warehouse solution.
Step “ANALYZE”:
- BigQuery is used to analyze data through SQL commands.
- Looker and Looker Studio of visualizing the result.
Step “ACTIVATE”: data is also the key to unlock Machine Learning on GC.
- Products include AutoML, Vertex AI workbench, and TensorFlow for large data.
-
STORING DETAILS:
Data sources are “connectors” that let you query data from various sources.
- “GC Data sources” can be classified into 2 types: Cloud Data sources (stored on GC) and external sources (on-premises, AWS, Azure,..).
GC storage options: database, warehouse, and data lake
-
Relational Database storing (table-storing): suited for large amounts of structured data.
-
Non-relational Database (NoSQL and not table-storing: text, audio, images): semi-structured data(less structured format). A flexible data model and it’s ideal for frequently changing data.
-
Data Warehouse: designed for analyzing data. it’s an enterprise system from multiple data sources (terabytes, petabytes).
- Data Lake: it’s a repository designed to ingest, store, explore, process, and analyze any type of volume of RAW data regardless the source. It can store:
- Different types of data.
- Keep data original format.
- Ignoring size limits.
- Without much pre-processing.
- Without adding structure.
- => Because of these, data lakes consists of many different products.
-
Big Query :
BigQuery Solution description
-
Main difference between “Data Warehouse” and “Data lake” is what? Warehouse includes structured or organised data and Data lake contains only raw or unstructured data.
-
BigQuery is a solution in “Data warehouse” to store transformed data for business insights.
-
BigQuery can perform “terabytes query” in seconds and “petabytes query” in minutes. For ex, one GC customer has over 350 petabytes stored in BigQuery. Another customer runs 10,000 concurrent queries at the same time.
-
BigQuery: Concurrent Queries can run over 100 trillion rows over multiple customers.
-
BigQuery is an “analytics engine”.
-
BigQuery contains 2 parts: a Query Engine (SQL-based functions) and a Fully-Managed Serverless Storage Layer (loading & storing).
-
BigQuery can also read data from external sources while streaming.
-
BigQuery ML and BI Engine for analyzing data.
-
BigQuery has 2 services in one: Store and analyze petabytes of data, like ML, geospatial analysis, business intelligence.
-
BigQuery is a fully-managed serverless solution, no worries about infrastructure (servers) anymore.
-
BigQuery is pay-as-you-go pricing model.
-
Data enscryption is “at rest” on BigQuery => encrypted data stored on disks.
-
BigQuery has built-in Machine Learning feature.
Derive Insight from data with BigQuery
-
BigQuery organise data tables into units called “dataset” (one dataset can include many tables like table 1, table 2) => default address: project.dataset.table.
-
Colosus: highly compressed columns in Google file sytem.
-
Support both: extremely large “bulk data ingest” and real-time “streaming ingest”.
-
Query can be submitted via: console, BigQuery web ui, bq, rest-API (7 languages).
-
DataProc is connectors between BigQuery and other GC services.
-
Queries can also run on CSV files in Cloud Storage (better) or even in Google Sheets (slower).
-
The amount of data to extract from the storage will also influence the cost, so only choose the columns or information you really need.
PRACTICE:
- Query a public dataset: activate “cloud console” API
- Create a new dataset:
- Load data into a new table:
- Query a custom table:
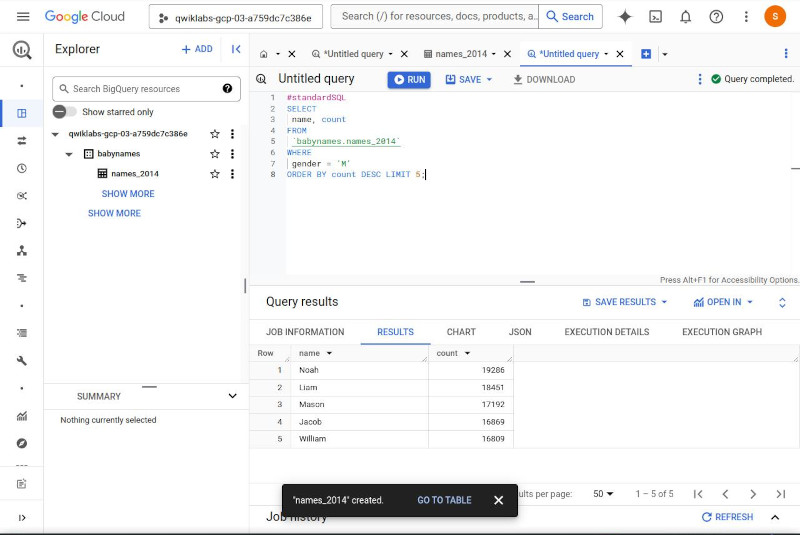
How BigQuery organises data-
There are 2 ways to contain tables in BigQuery: dataset and project. (one project can contain many datasets, one dataset can contain many data tables)
-
Table schema could be input directly or Cloud console or self-describe format like Json files, Avro, Parquet, ORC, Firestore export, or Datastore export.
-
BigQuery is also called “Columnar Storing” = designed to process columns NOT rows.
-
Massively distributed format : BigQuery divide tables in “smaller shards of data”, enabling massively parallel operations (reading,..). Most Google products use this storing format.
-
- OBJECTIVES:
-
Day 1 : First Lab.
Google Cloud: include all cloud services such as computing, storage, data analytics, machine learning, APIs,.. that can be integrated with your cloud projects.
Google Clound Skills Boost: a catalog of courses and labs for learing and mangage your learning path. Qwiklabs is the platform for all courses and labs to run.
Lab: it maybe free or not. Lab is a class to learn certain skills in a limited time. We must press “START” to start a new lab and “END” to submit our reading and answers because all our answers will be removed when the time runs out.
Cloud Console: includes “email”, “pass”, “project-id” for login
Admin and User: to see users, click “Navigation Menu” (or ☰) => IAM
API & Services: click ☰ => APIs & Services => Library
-
API means “application programming interface” that has some functionality we can use in our cloud project.
-
In the search bar: search “Dialogflow API”, then enable it. Click “Try this API”, a new tag appears, show a list of Cloud terms and their explanations for us to understand more easily during our reading.
-
If we create a project in a lab, most APIs are integrated automatically in a new project. But when we create a project outside a lab, we have to enable the APIs we want. It’s like the API “Dialogflow” we have enabled above.
-